Stata: Kaplan-Meir曲線
Stataの特徴は比較的簡単に美しいグラフの作成できることです。Stataのサンプルデータdrug2を使って、Kaplan-Meier曲線(白黒)を作成してみましょう。
use https://www.stata-press.com/data/r16/drug2
sts graph, by(drug)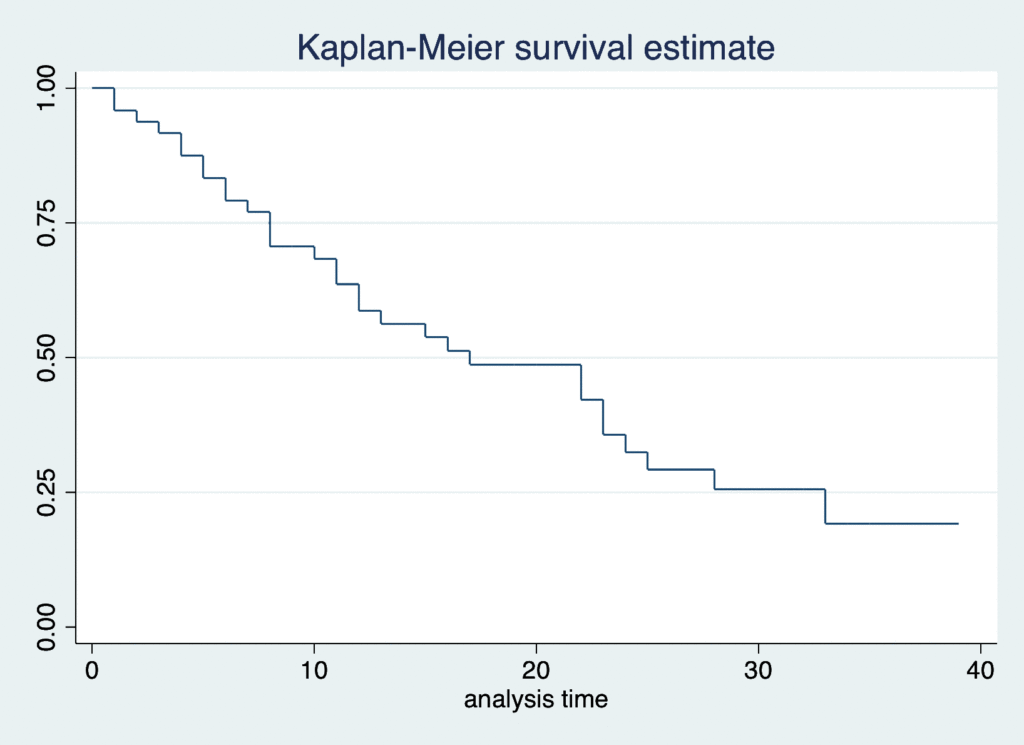
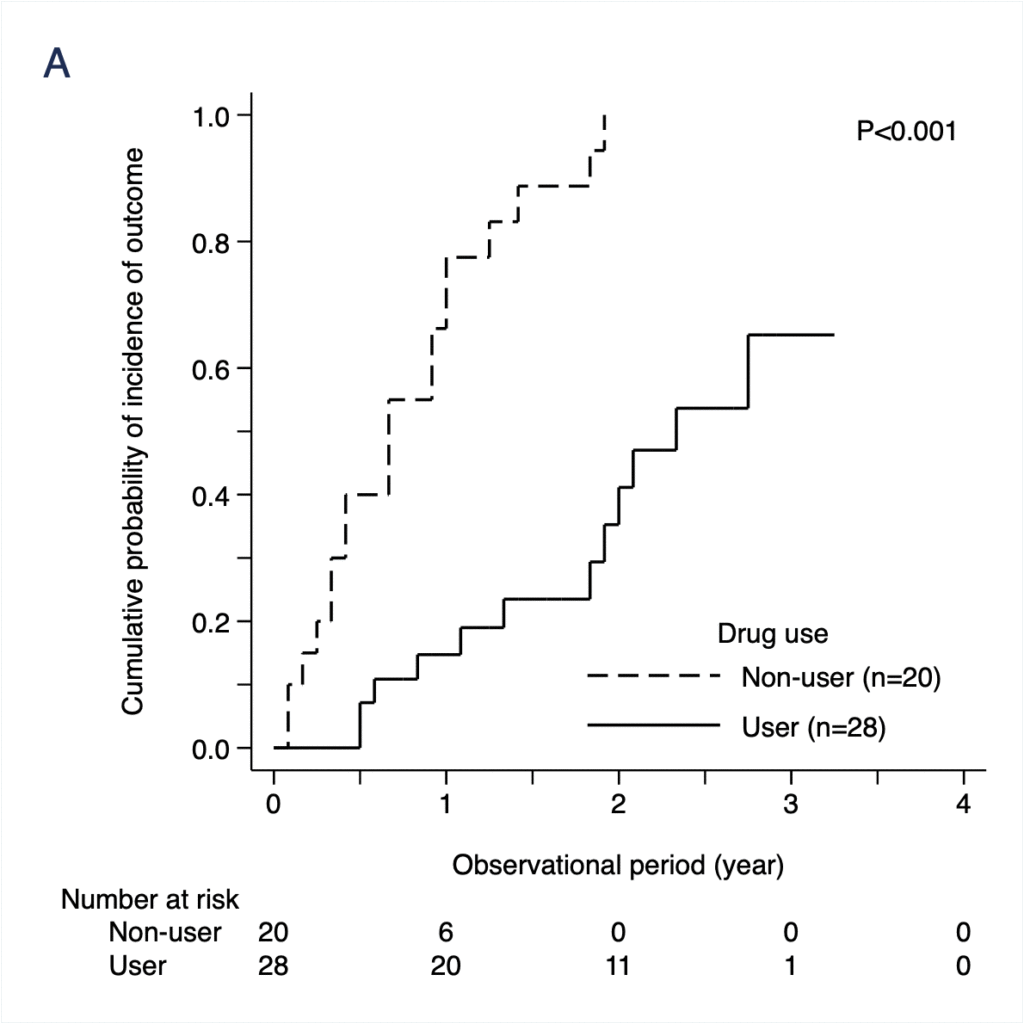
このKaplan-Meier曲線に設定を追加して、下図を作成します。
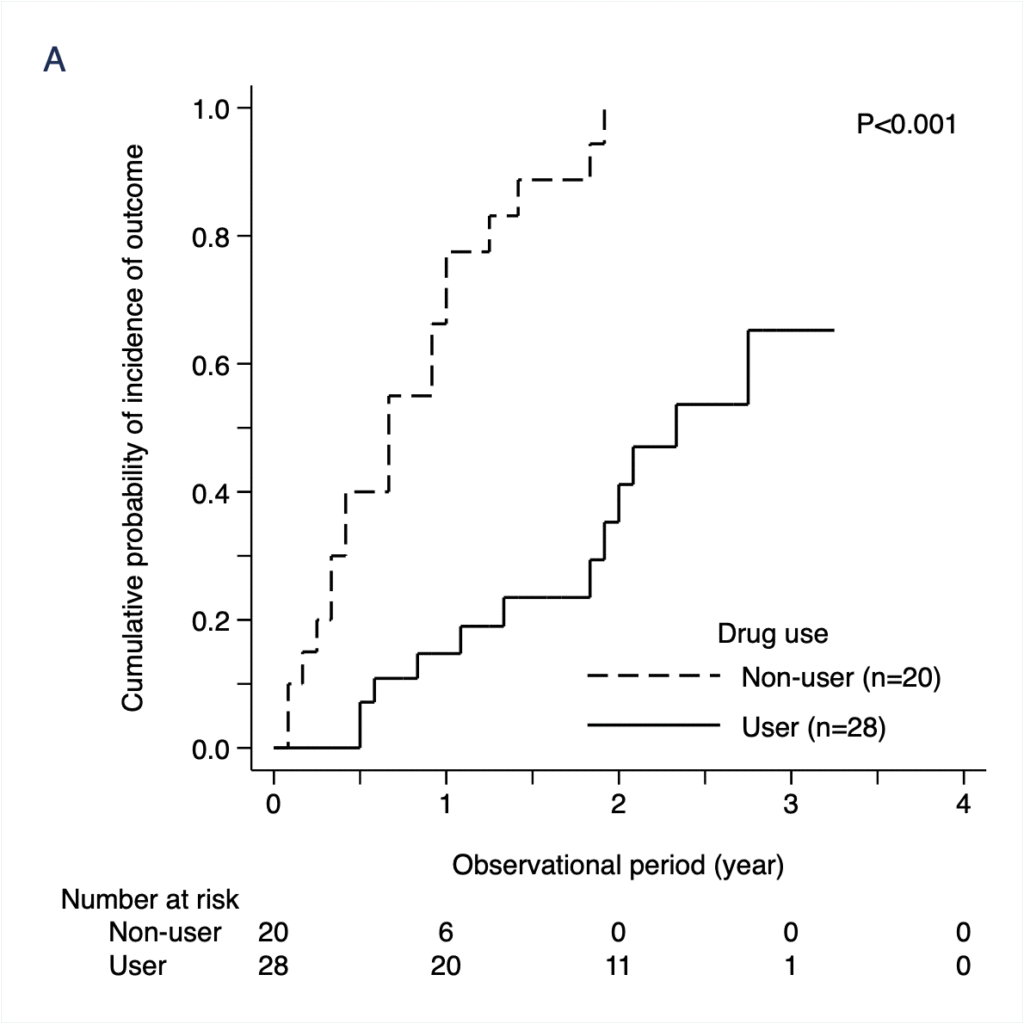
この図を作成するためには、以下の魔法を唱える必要があります。
sts graph, xsize(3.7) ysize(3.7) by(drug) failure ytitle("Cumulative probability of incidence of outcome" " ", size(small)) ylabel(0.0(0.2)1, angle(0) labsize(small) format(%9.1f) nogrid) ytick(0.0(0.1)0.6) xtitle(" " "Observational period (year)", size(small)) xlabel(0 "0" 12 "1" 24 "2" 36 "3" 48 "4", labsize(small)) xtick(0(6)48) title("A", size("medlarge") span position(11)) plot1opt(lpattern(dash)) plot2opt(lpattern(solid)) plotopt(lcolor(black)) legend(ring(0) position(5) cols(1) region(lcolor(white)) order(1 "Non-user (n=20)" 2 "User (n=28)") size(small) title("Drug use", size("small") color("black"))) risktable(0(12)48, size(small) order(1 "Non-user" 2 "User") rowtitle(, justification(left)) title(, size(small))) text(1 48 "P<0.001", placement(sw) size(small)) graphregion(color(white) lcolor(white))それでは、この魔法が作られた過程を確認していきましょう。
グラフのサイズを変更する
A4サイズ(8.27 × 11.69インチ)に2 x 3個のグラフが収まるサイズにしたいので、図のサイズを3.7 × 3.7 インチに設定します。
sts graph, xsize(3.7) ysize(3.7)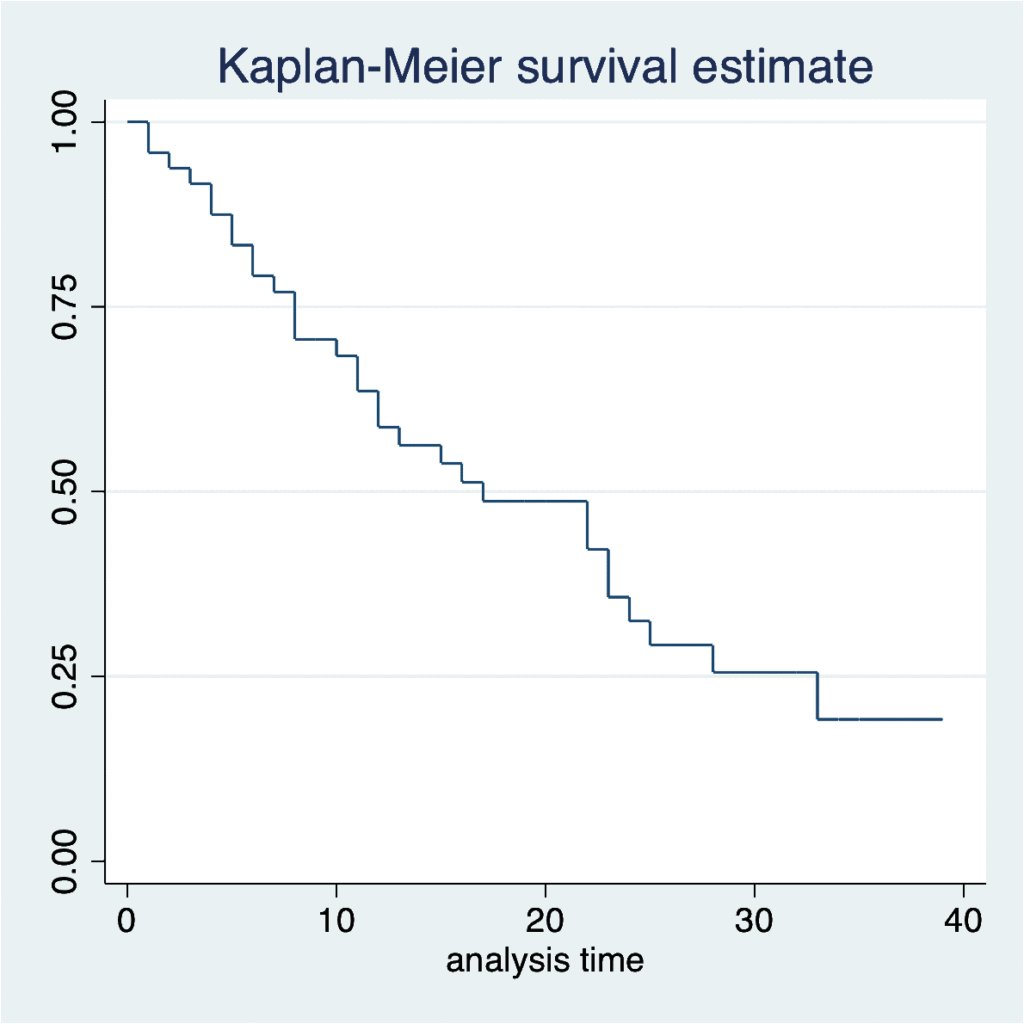
カテゴリ別の累積アウトカム発症率を算出する
Y軸を、累積生存率ではなく、累積アウトカム発症率に変更し、durgカテゴリ別のKaplan-Meier曲線を描きます。
sts graph, xsize(3.7) ysize(3.7) by(drug) failure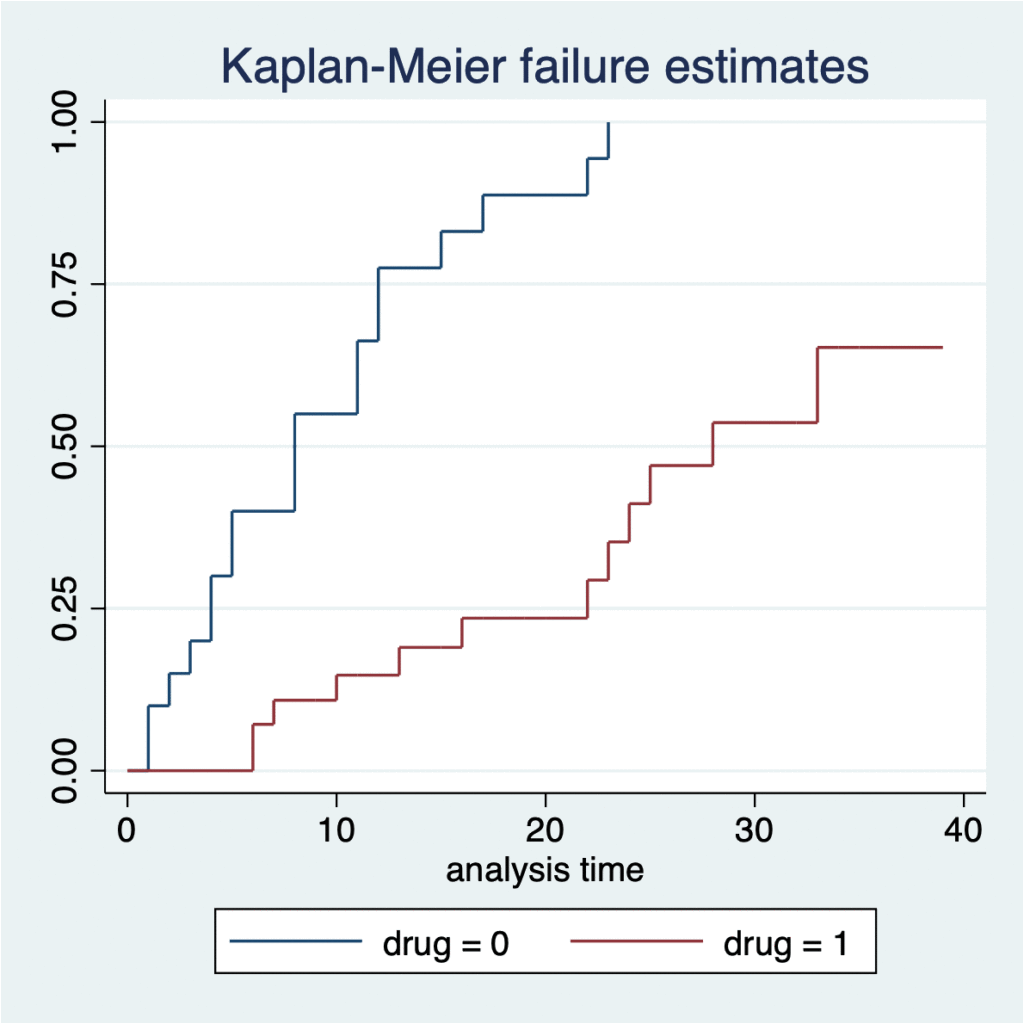
Y軸を調整する
Y軸名(ytitle)を”Cumulative probability of incidence of outcome”にします。デフォルトの文字サイズは大きいので、小さくします(small)。デフォルト設定のままだと軸と軸名がくっつきすぎるので、Y軸名に空白行を1行挿入して、軸と軸名の間隔を少し広げます。
Y軸の数値(ylabel)の向き(angle)を水平にして、その間隔を0.2にしますが、目盛り線(tick)の間隔は0.1にします。ラベルの文字を少し小さくして(small)、小数点1桁表示にします。ガイド線(グリッド)を消します。
sts graph, xsize(3.7) ysize(3.7) by(drug) failure ytitle("Cumulative probability of incidence of outcome" " ", size(small)) ylabel(0.0(0.2)1, angle(0) labsize(small) format(%9.1f) nogrid) ytick(0.0(0.1)0.6)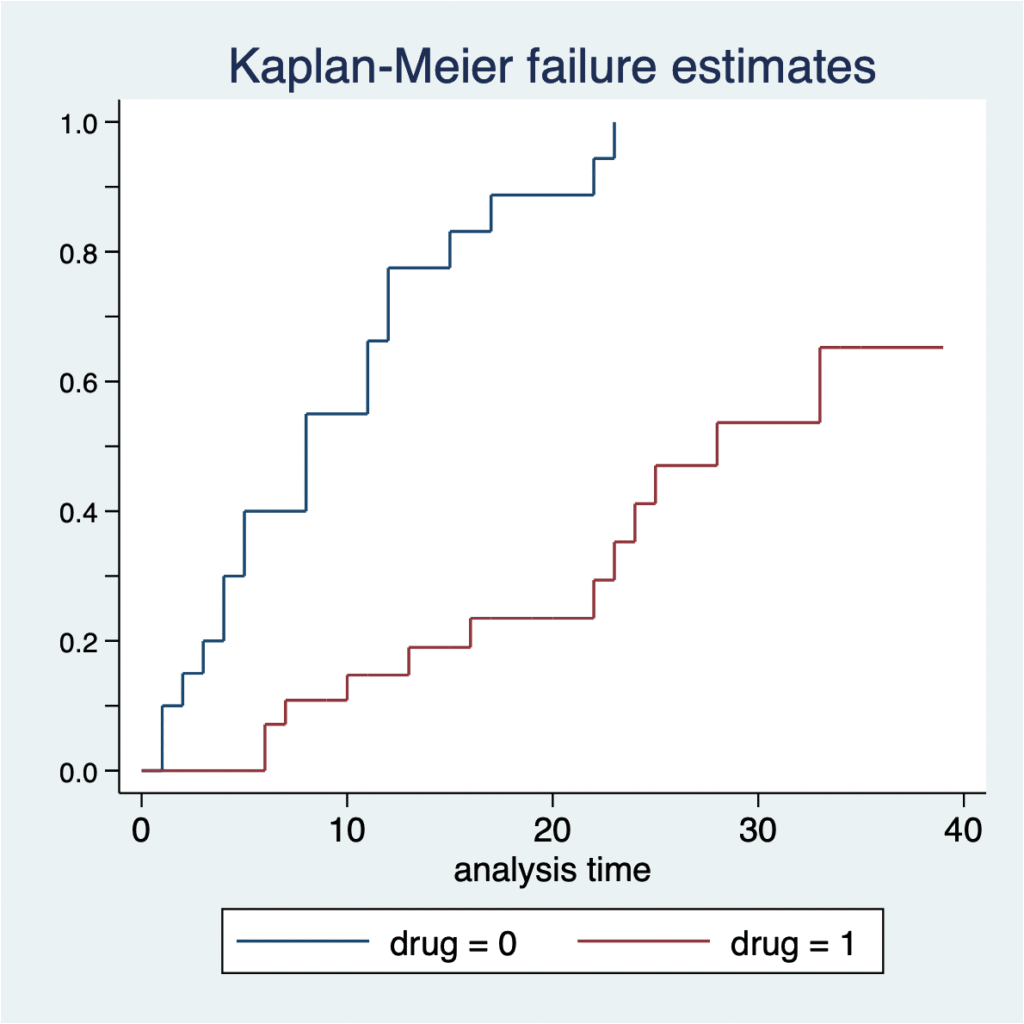
X軸を調整する
X軸名(xtitle)を”Observational period (year)”にします。デフォルトの文字サイズは大きいので、小さくします(small)。デフォルト設定のままだと軸と軸名がくっつきすぎるので、X軸名に空白行を1行挿入して、軸と軸名の間隔を少し広げます。
追跡期間データの単位は月(0〜48)ですが、X軸の単位を年に変換するために、第0, 12, 24, 36, 48月に0, 1, 2, 3, 4を表示させます。目盛り線(tick)の間隔を6ヶ月にします。ラベルの文字を少し小さくします(small)。
sts graph, xsize(3.7) ysize(3.7) by(drug) failure ytitle("Cumulative probability of incidence of outcome" " ", size(small)) ylabel(0.0(0.2)1, angle(0) labsize(small) format(%9.1f) nogrid) ytick(0.0(0.1)0.6) xtitle(" " "Observational period (year)", size(small)) xlabel(0 "0" 12 "1" 24 "2" 36 "3" 48 "4", labsize(small)) xtick(0(6)48)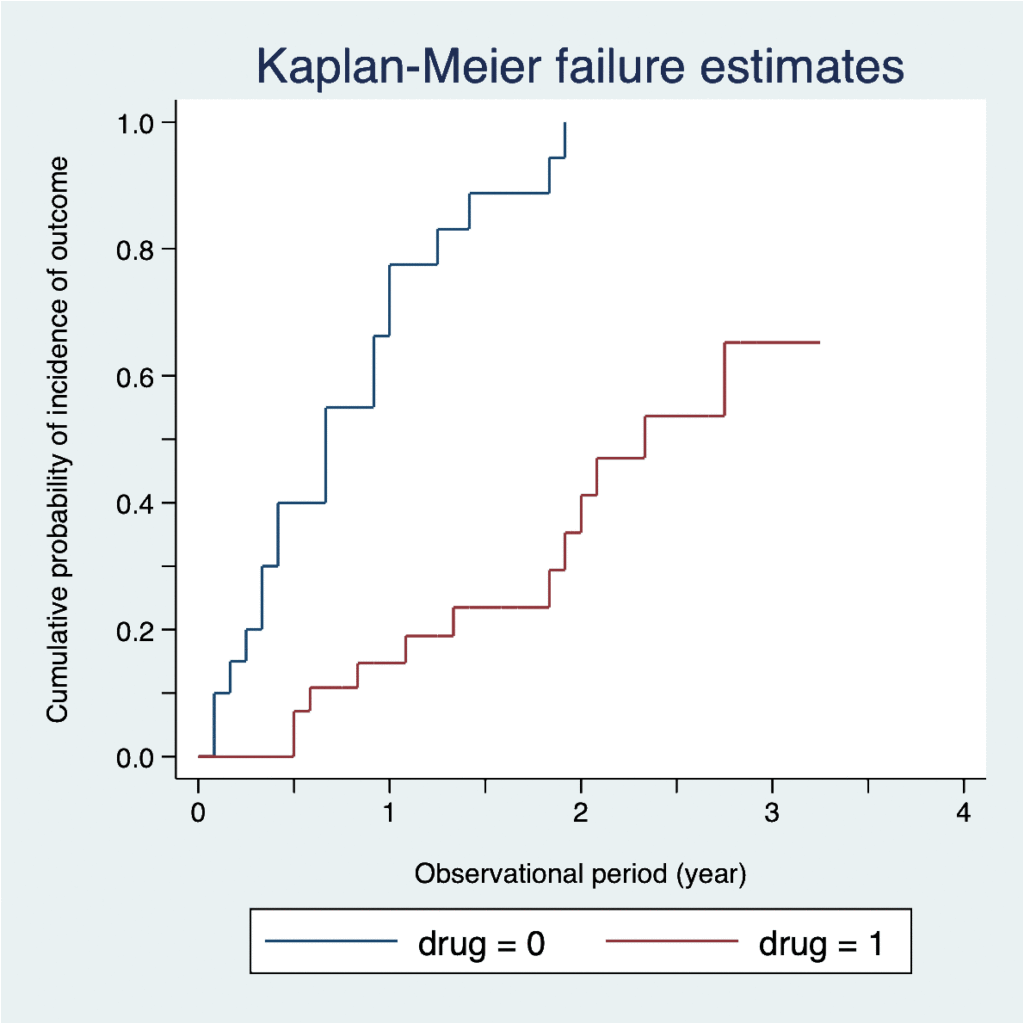
タイトルを変更する
グラフのタイトル”A”を、グラフ全体の左上にやや大きめ(medlarge)で追加します。
sts graph, xsize(3.7) ysize(3.7) by(drug) failure ytitle("Cumulative probability of incidence of outcome" " ", size(small)) ylabel(0.0(0.2)1, angle(0) labsize(small) format(%9.1f) nogrid) ytick(0.0(0.1)0.6) xtitle(" " "Observational period (year)", size(small)) xlabel(0 "0" 12 "1" 24 "2" 36 "3" 48 "4", labsize(small)) xtick(0(6)48) title("A", size("medlarge") span position(11)) 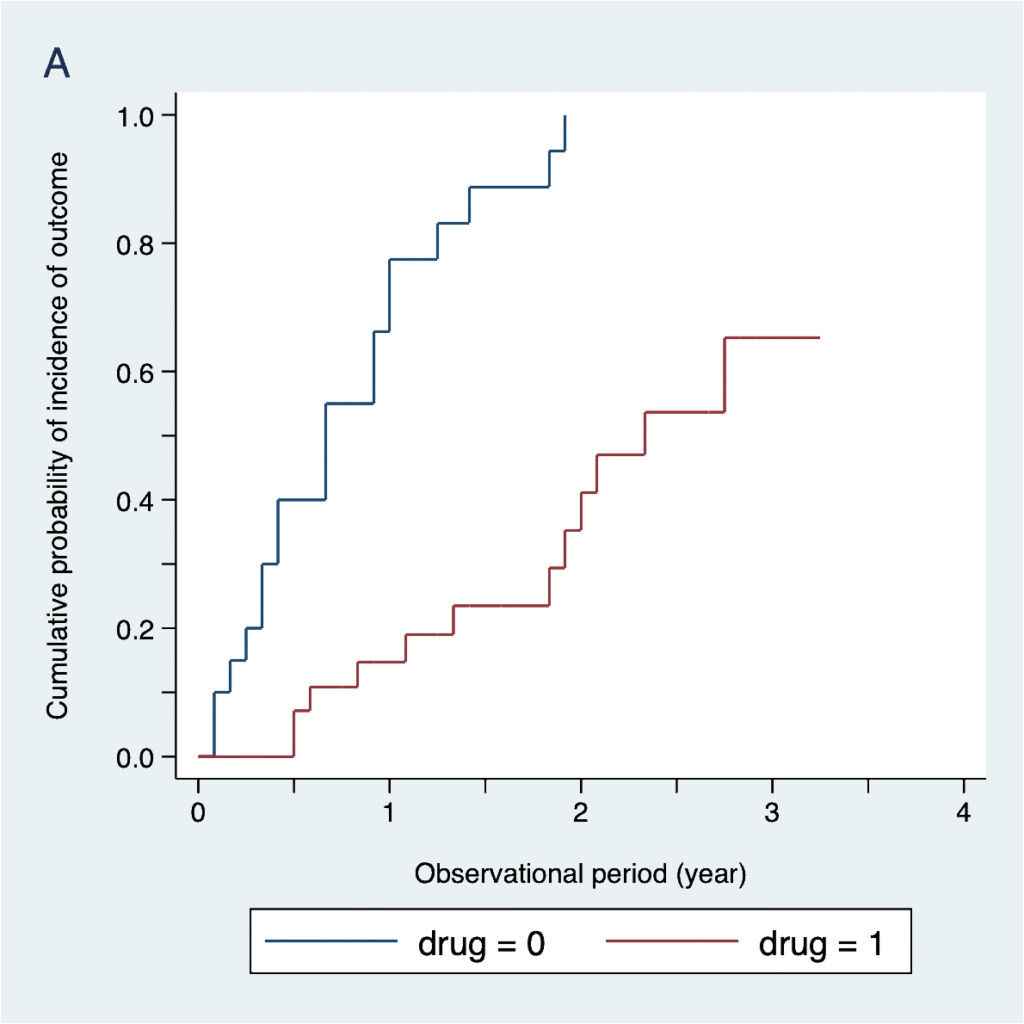
生存曲線のレイアウトを変更する
drugカテゴリ別の生存曲線のレイアウトを変更します。カラーイラストは論文掲載料が追加されることが多いので、生存曲線の色を黒に統一して、drug=0を点線、drug=1を実線に設定します。
sts graph, xsize(3.7) ysize(3.7) by(drug) failure ytitle("Cumulative probability of incidence of outcome" " ", size(small)) ylabel(0.0(0.2)1, angle(0) labsize(small) format(%9.1f) nogrid) ytick(0.0(0.1)0.6) xtitle(" " "Observational period (year)", size(small)) xlabel(0 "0" 12 "1" 24 "2" 36 "3" 48 "4", labsize(small)) xtick(0(6)48) title("A", size("medlarge") span position(11)) plot1opt(lpattern(dash)) plot2opt(lpattern(solid)) plotopt(lcolor(black))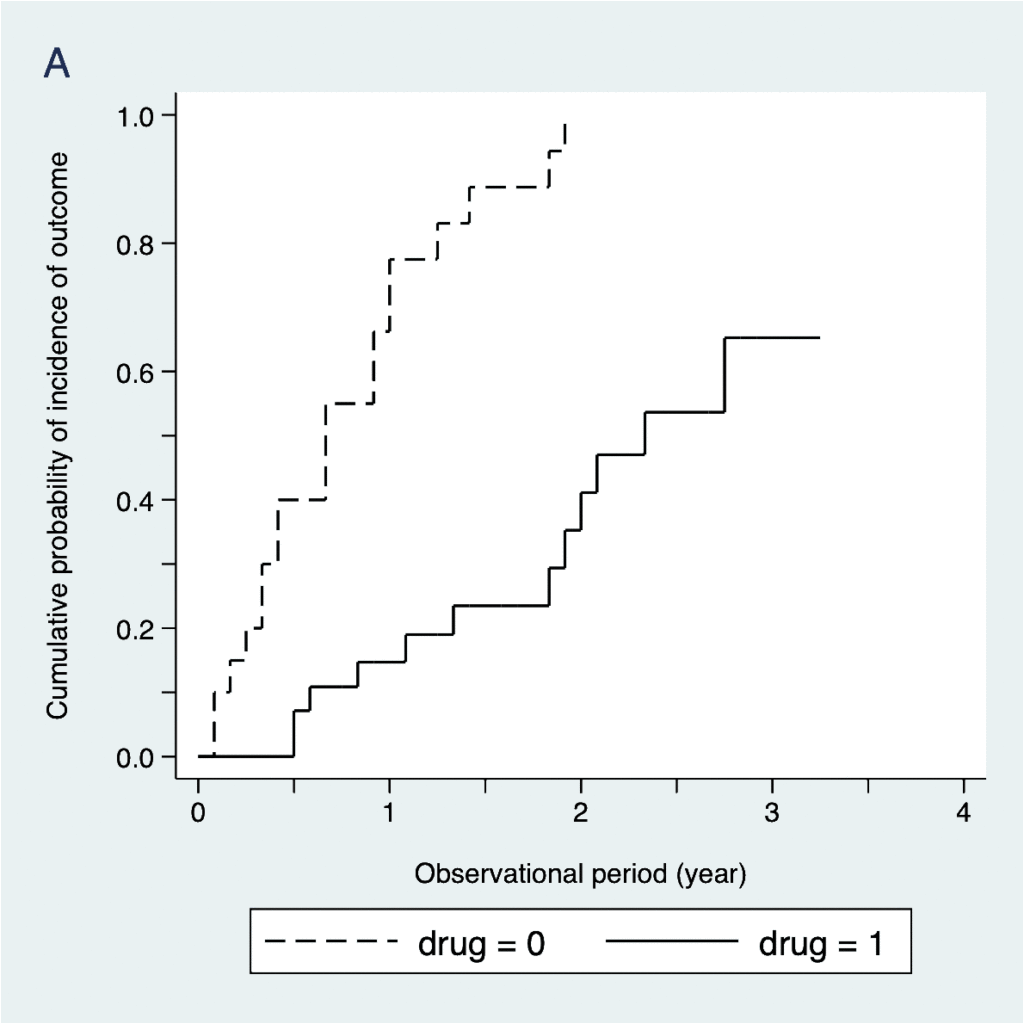
凡例を修正する
凡例を、生存曲線のプロット領域内(ring(0))の右下(5時方向)に、縦1列(cols(1))で表示する。枠線を白に設定して見えなくする(region(lcolor(white)))。カテゴリ名を”Drug use”にして、drugカテゴリ0には”Non-user (n=20)”を、drugカテゴリ1には”User (n=28)”を、黒文字で小さめに表示する。
sts graph, xsize(3.7) ysize(3.7) by(drug) failure ytitle("Cumulative probability of incidence of outcome" " ", size(small)) ylabel(0.0(0.2)1, angle(0) labsize(small) format(%9.1f) nogrid) ytick(0.0(0.1)0.6) xtitle(" " "Observational period (year)", size(small)) xlabel(0 "0" 12 "1" 24 "2" 36 "3" 48 "4", labsize(small)) xtick(0(6)48) title("A", size("medlarge") span position(11)) plot1opt(lpattern(dash)) plot2opt(lpattern(solid)) plotopt(lcolor(black)) legend(ring(0) position(5) cols(1) region(lcolor(white)) order(1 "Non-user (n=20)" 2 "User (n=28)") size(small) title("Drug use", size("small") color("black")))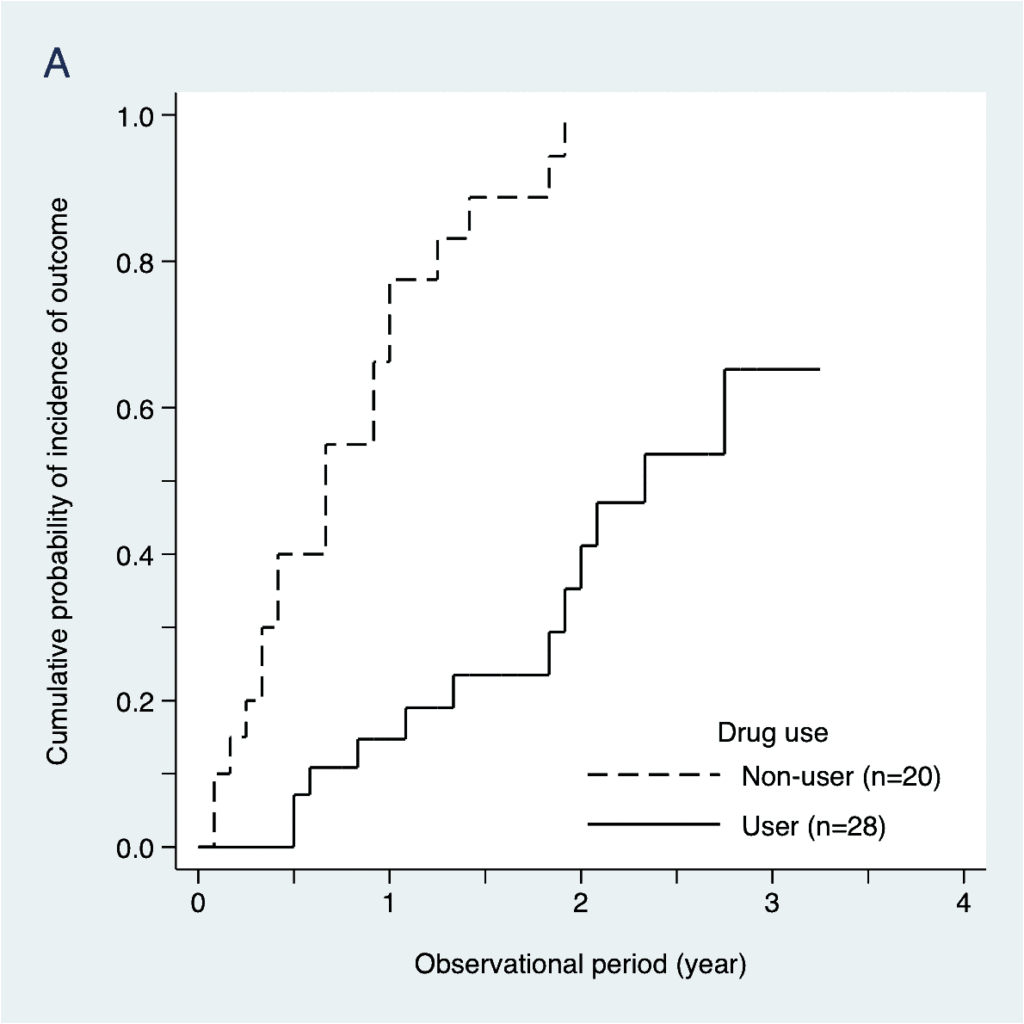
Number at riskを追加する
Number at riskを12ヶ月毎に追加する。drugカテゴリ名は小さめ(small)に左揃えで”Non-user”と”User”と表示する。
sts graph, xsize(3.7) ysize(3.7) by(drug) failure ytitle("Cumulative probability of incidence of outcome" " ", size(small)) ylabel(0.0(0.2)1, angle(0) labsize(small) format(%9.1f) nogrid) ytick(0.0(0.1)0.6) xtitle(" " "Observational period (year)", size(small)) xlabel(0 "0" 12 "1" 24 "2" 36 "3" 48 "4", labsize(small)) xtick(0(6)48) title("A", size("medlarge") span position(11)) plot1opt(lpattern(dash)) plot2opt(lpattern(solid)) plotopt(lcolor(black)) legend(ring(0) position(5) cols(1) region(lcolor(white)) order(1 "Non-user (n=20)" 2 "User (n=28)") size(small) title("Drug use", size("small") color("black"))) risktable(0(12)48, size(small) order(1 "Non-user" 2 "User") rowtitle(, justification(left)) title(, size(small)))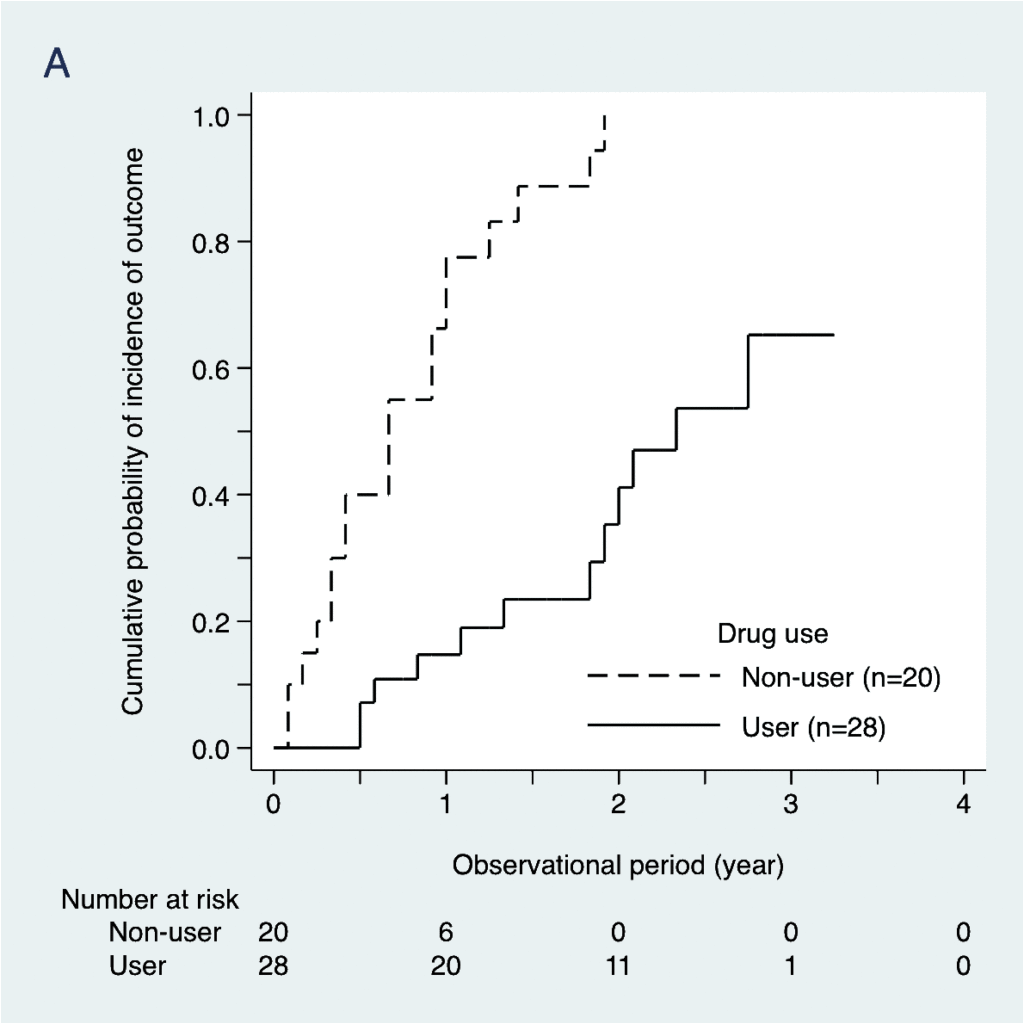
テキスト(P値)を追加する
XY座標(1, 48)の左下(sw = southwest)にテキスト”P<0.001″を追加する。
sts graph, xsize(3.7) ysize(3.7) by(drug) failure ytitle("Cumulative probability of incidence of outcome" " ", size(small)) ylabel(0.0(0.2)1, angle(0) labsize(small) format(%9.1f) nogrid) ytick(0.0(0.1)0.6) xtitle(" " "Observational period (year)", size(small)) xlabel(0 "0" 12 "1" 24 "2" 36 "3" 48 "4", labsize(small)) xtick(0(6)48) title("A", size("medlarge") span position(11)) plot1opt(lpattern(dash)) plot2opt(lpattern(solid)) plotopt(lcolor(black)) legend(ring(0) position(5) cols(1) region(lcolor(white)) order(1 "Non-user (n=20)" 2 "User (n=28)") size(small) title("Drug use", size("small") color("black"))) risktable(0(12)48, size(small) order(1 "Non-user" 2 "User") rowtitle(, justification(left)) title(, size(small))) text(1 48 "P<0.001", placement(sw) size(small))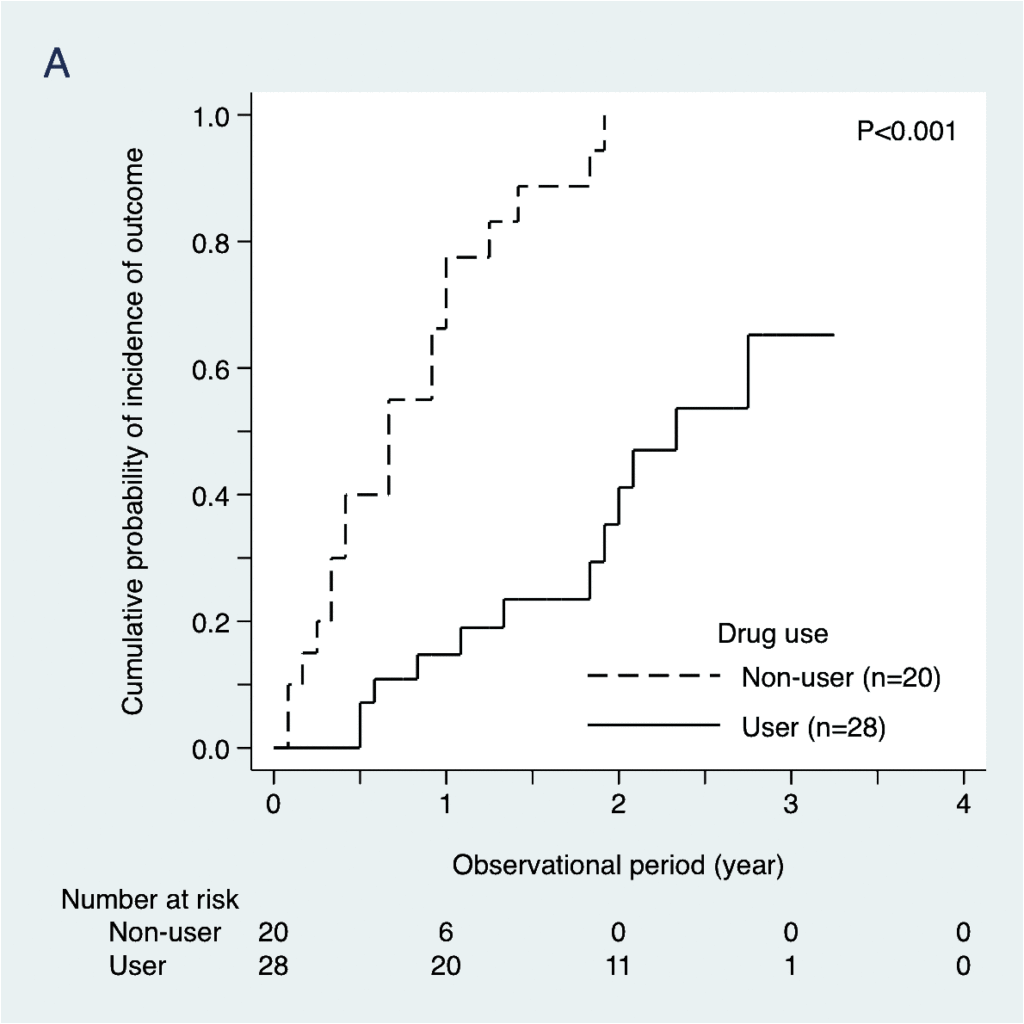
テキストの配置(placement)には、sw以外にも下記を設定できます。テキストの表示位置に応じて適宜変更して下さい。
- c = centered on the point, vertically and horizontally
- n = above the point, centered
- ne = above and to the right of the point
- e = right of the point, vertically centered
- se = below and to the right of the point
- s = below point, centered
- sw = below and to the left of the point
- w = left of the point, vertically centered
- nw = above and to the left of the point
Stata公式マニュアル https://www.stata.com/manuals/g-3added_text_options.pdf
背景色を変更する
グラフ領域の背景を白色に設定して完成!
sts graph, xsize(3.7) ysize(3.7) by(drug) failure ytitle("Cumulative probability of incidence of outcome" " ", size(small)) ylabel(0.0(0.2)1, angle(0) labsize(small) format(%9.1f) nogrid) ytick(0.0(0.1)0.6) xtitle(" " "Observational period (year)", size(small)) xlabel(0 "0" 12 "1" 24 "2" 36 "3" 48 "4", labsize(small)) xtick(0(6)48) title("A", size("medlarge") span position(11)) plot1opt(lpattern(dash)) plot2opt(lpattern(solid)) plotopt(lcolor(black)) legend(ring(0) position(5) cols(1) region(lcolor(white)) order(1 "Non-user (n=20)" 2 "User (n=28)") size(small) title("Drug use", size("small") color("black"))) risktable(0(12)48, size(small) order(1 "Non-user" 2 "User") rowtitle(, justification(left)) title(, size(small))) text(1 48 "P<0.001", placement(sw) size(small)) graphregion(color(white) lcolor(white))